Overview
This guide describes sources of information for understanding when things go wrong.
Whether you're customizing out-of-the-box blueprints, or developing your own custom blueprints, you will inevitably have to deal with entity failure. Thankfully Brooklyn provides plenty of information to help you locate and resolve any issues you may encounter.
Web-console Runtime Error Information
Entity Hierarchy
The Brooklyn web-console includes a tree view of the entities within an application. Errors within the application are represented visually, showing a "fire" image on the entity.
When an error causes an entire application to be unexpectedly down, the error is generally propagated to the top-level entity - i.e. marking it as "on fire". To find the underlying error, one should expand the entity hierarchy tree to find the specific entities that have actually failed.
Entity's Error Status
Many entities have some common sensors (i.e. attributes) that give details of the error status:
service.isUp(often referred to as "service up") is a boolean, saying whether the service is up. For many software processes, this is inferred from whether the "service.notUp.indicators" is empty. It is also possible for some entities to set this attribute directly.service.notUp.indicatorsis a map of errors. This often gives much more information than the singleservice.isUpattribute. For example, there may be many health-check indicators for a component: is the root URL reachable, it the management API reporting healthy, is the process running, etc.service.problemsis a map of namespaced indicators of problems with a service.service.stateis the actual state of the service - e.g. CREATED, STARTING, RUNNING, STOPPING, STOPPED, DESTROYED and ON_FIRE.service.state.expectedindicates the state the service is expected to be in (and when it transitioned to that). For example, is the service expected to be starting, running, stopping, etc.
These sensor values are shown in the "sensors" tab - see below.
Sensors View
The "Sensors" tab in the Brooklyn web-console shows the attribute values of a particular entity. This gives lots of runtime information, including about the health of the entity - the set of attributes will vary between different entity types.
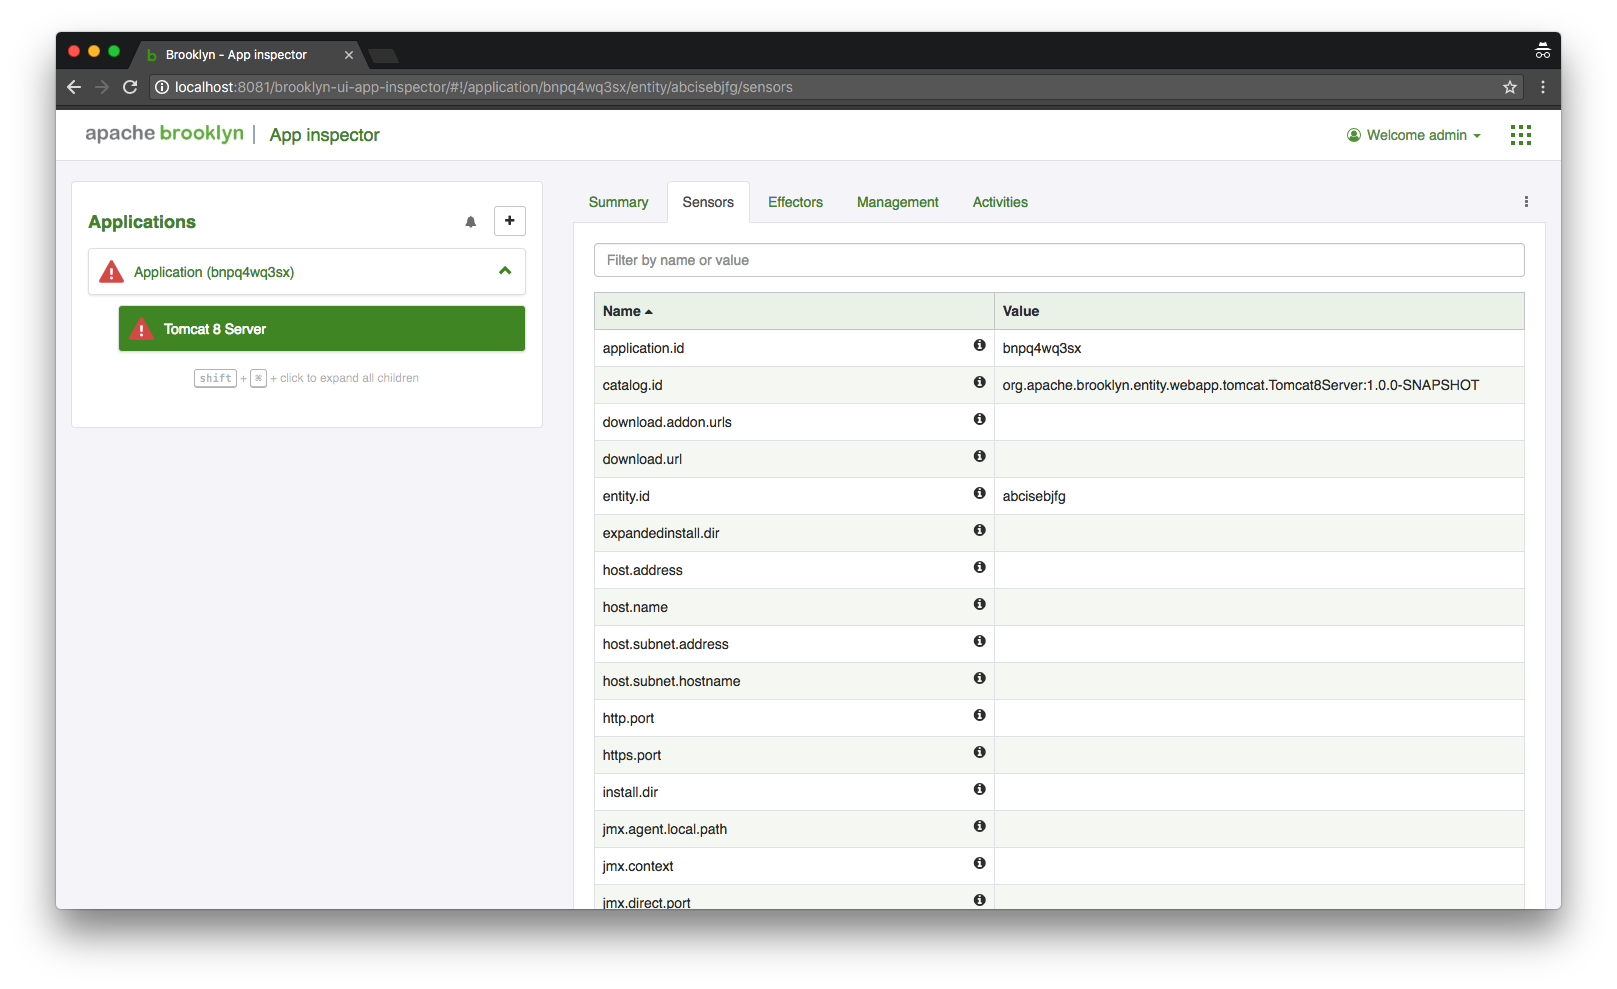
There is also a search bar (at the top) to filter the sensors shown.
Activity View
The activity view shows the tasks executed by a given entity. The top-level tasks are the effectors (i.e. operations) invoked on that entity. This view allows one to drill into the task, to see details of errors.
Select the entity, and then click on the Activities tab.
In the table showing the tasks, each row is a link - clicking on the row will drill into the details of that task, including sub-tasks:

For ssh tasks, this allows one to drill down to see the env, stdin, stdout and stderr. That is, you can see the commands executed (stdin) and environment variables (env), and the output from executing that (stdout and stderr).
For tasks that did not fail, one can still drill into the tasks to see what was done.
It's always worth looking at the Detailed Status section as sometimes that will give you the information you need. For example, it can show the exception stack trace in the thread that was executing the task that failed.
Log Files
Brooklyn's logging is configurable, for the files created, the logging levels, etc. See Logging docs.
With out-of-the-box logging, brooklyn.info.log and brooklyn.debug.log files are created. These are by default
rolling log files: when the log reaches a given size, it is compressed and a new log file is started.
Therefore check the timestamps of the log files to ensure you are looking in the correct file for the
time of your error.
With out-of-the-box logging, info, warnings and errors are written to the brooklyn.info.log file. This gives
a summary of the important actions and errors. However, it does not contain full stacktraces for errors.
To find the exception, we'll need to look in Brooklyn's debug log file. By default, the debug log file
is named brooklyn.debug.log. You can use your favourite tools for viewing large text files.
One possible tool is less, e.g. less brooklyn.debug.log. We can quickly find the last exception
by navigating to the end of the log file (using Shift-G), then performing a reverse-lookup by typing ?Exception
and pressing Enter. Sometimes an error results in multiple exceptions being logged (e.g. first for the
entity, then for the cluster, then for the app). If you know the text of the error message (e.g. copy-pasted
from the Activities view of the web-console) then one can search explicitly for that text.
The grep command is also extremely helpful. Useful things to grep for include:
- The entity id (see the "summary" tab of the entity in the web-console for the id).
- The entity type name (if there are only a small number of entities of that type).
- The VM IP address.
- A particular error message (e.g. copy-pasted from the Activities view of the web-console).
- The word WARN etc, such as
grep -E "WARN|ERROR" brooklyn.info.log.
Grep'ing for particular log messages is also useful. Some examples are shown below:
- INFO: "Started application", "Stopping application" and "Stopped application"
- INFO: "Creating VM "
- DEBUG: "Finished VM "